


Climate Change Response
Performance Results
- In 2024, the replacement of 400 tons of ice water chillers improved single-unit energy efficiency by 38.2%.
- Through the AI food waste management system, the average food waste per person at the buffet restaurant Belle Table decreased by 47.3%, equivalent to a reduction of 55.4 tons of carbon emissions.
- The "EcoMeet Sustainable Meetings" project attracted participation from 141 companies, accounting for 21.5% of the total annual meetings, with a total of 24,871 attendees.
Single-unit energy efficiency improvement
38.2 %
Average food waste per person in the buffet restaurant decreased
47.3 %
"EcoMeet Sustainable Meetings" of total annual meetings
21.5 %
Future Goals
- Purchase energy-efficient labeled equipment.
- Fully switch to large-capacity refillable bottles and reduce paper usage by 3–5% annually.
- Gradually increase low-carbon and carbon-footprint products by 2% annually.
- Achieve 2–5% use of renewable energy by 2030.
- Reduce the proportion of imported raw materials by 5% within three years.
- Develop a carbon neutrality roadmap and renewable energy utilization plan in response to climate policies.
Impact
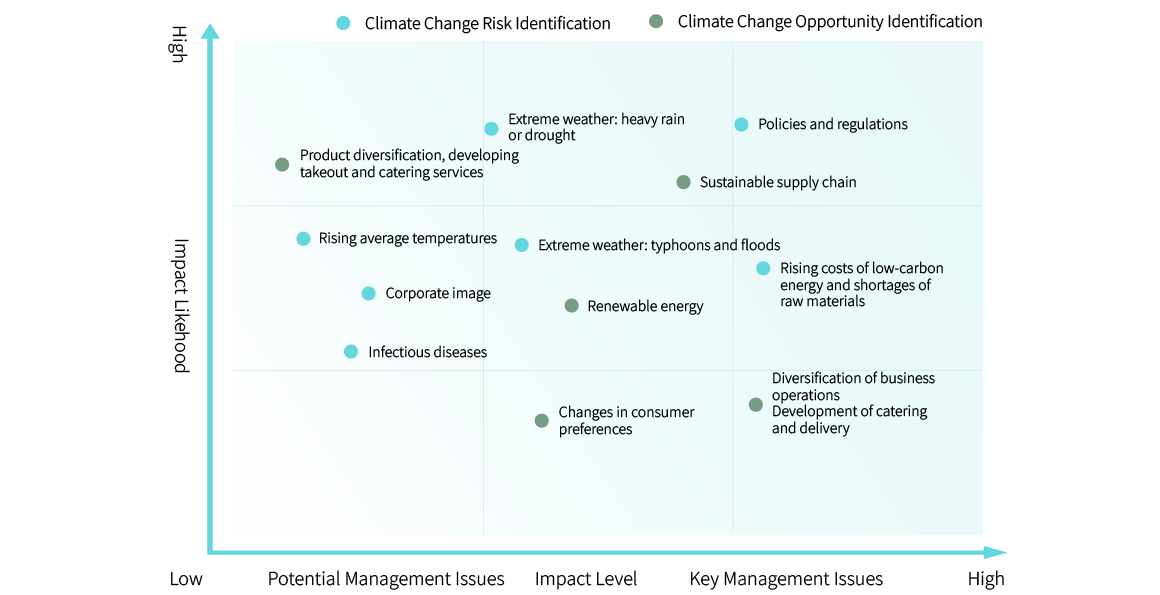
In response to climate change, the Group has identified five key risks: stricter environmental and regulatory policies (e.g., carbon taxes and carbon pricing), rising costs of low-carbon energy, raw material shortages and price increases, sustainable supply chain management, and changing consumer preferences requiring product and service transformation. Operationally, compliance costs and customers' green choices may lead to cost pass-through and potential reductions in market competitiveness.
Policy Commitment
The Group responds to government greenhouse gas reduction policies and international net-zero trends by establishing a Climate Action Policy and endorsing the 1.5°C Climate Action Declaration. Upholding the principles of responsible resource use and accountability, the Group implements low-carbon transition measures and environmentally friendly initiatives, demonstrating its proactive commitment to addressing climate change.
Actions Taken
The Group has established an Environmental Sustainability Task Force and an energy management system to drive equipment upgrades and improve energy efficiency. Technologies such as LED lighting, smart temperature controls, low-flow faucets, and AI food waste systems are implemented to enhance energy and water resource management. At the same time, waste sorting and recycling initiatives are promoted to achieve low-carbon operations.
- Improving energy efficiency
Established an Environmental Sustainability Task Force and an energy management system to drive equipment upgrades and improve energy efficiency. - Water resource management
Implemented technologies such as LED lighting, smart temperature controls, low-flow faucets, and AI food waste systems to enhance energy conservation and water resource management. - Waste management
Promoted waste sorting and recycling initiatives to achieve low-carbon operations.
Evaluation Mechanisms
- Reduction effectiveness evaluation
The Energy Management Team monitors data daily and reviews results monthly. The ESG Team tracks implementation during quarterly meetings and regularly reports progress to the Board of Directors. - Supply chain evaluation
Suppliers' sustainability performance is periodically reviewed to ensure strategies are effectively implemented and risk management measures are adjusted promptly. - ESG team meetings
Quarterly discussions are held to ensure all measures are effectively executed and achieve the intended outcomes, with regular reporting to the Board of Directors.
Stakeholder Engageme
The Group discloses its climate action achievements through reports and actively communicates with customers, employees, communities, and government agencies. It promotes customer participation in environmental initiatives, employee training, and community environmental activities, implementing SDGs Goals 7, 12, and 13, while fostering consensus and action among stakeholders.

Governance
The Group has established a Sustainability Committee, under which the Environmental Sustainability Task Force is responsible for identifying climate-related issues. The Group has also adopted the TCFD framework for climate-related financial disclosures as a key reference for internally assessing climate risks and financial impacts. Issues and strategies proposed by the Environmental Sustainability Task Force are evaluated and approved by management, and implementation progress and effectiveness are reported annually to the Board of Directors, ensuring transparency and accountability in climate governance.
Strategy
The Group identifies and assesses risks related to the low-carbon economy transition and physical climate impacts, clearly outlining five key risk management issues.
| Identified Risks and Opportunities | Risk Description | Potential Impact on Operations and Finances | Impact Level / Timeframe | Response Strategies and Goals |
|---|---|---|---|---|
| Policies and Regulations | Under the Energy Management Act, an annual electricity savings target of 1% must be achieved. The scope of carbon fees and carbon taxes may expand. |
|
High / Long-term |
|
|
Technical Risks
Increased Costs of Low-carbon Technology Transition |
With the rapid development of energy-saving and carbon-reduction technologies, failure to adopt them in a timely manner may result in a loss of competitiveness. | Switching products and services to low-carbon alternatives may increase costs. | Medium / Medium-term | Adopt low-carbon amenities and services, introducing products with lower carbon footprints (e.g., bio-based cleaning agents, recycled materials) and suppliers, to build a green supply chain. |
Market Risks
|
With increasing consumer awareness of environmental sustainability, demand for products and services is shifting. | Revenue and occupancy rates may decline, market share may shrink, and brand image could be affected. | Medium / Long-term |
|
|
Reputational Risks
Corporate image |
Damage to reputation reduces consumer trust. | Increases labor recruitment costs, decreases revenue, and may lead to loss of business partners. | Medium / Long-term |
|
| Identified Risks and Opportunities | Risk Description | Potential Impact on Operations and Finances | Impact Level / Timeframe | Response Strategies and Goals |
|---|---|---|---|---|
|
Immediate (Extreme) Risks
Typhoons, Floods |
|
Increased operational costs and reduced business performance; frequent incidents and enhanced coverage conditions may result in higher insurance premiums. | Medium/Long-term |
|
|
Long-term Risks
Heavy Rain / Drought / Infectious Diseases |
Heavy rain may cause equipment damage and revenue loss; drought may disrupt power and water supply, affecting operations. |
|
High/Long-term |
|
| Rising Average Temperatures |
|
|
Medium/Long-term |
|
| Identified Risks and Opportunities | Risk Description | Potential Impact on Operations and Finances | Impact Level / Timeframe | Response Strategies and Goals |
|---|---|---|---|---|
| Resource Use Efficiency | Use higher-efficiency LED lighting, replace old system pumps, and adopt dual-effect energy-saving equipment with heat pump systems. |
|
Medium/Mid-term |
|
| Energy Sources | Digital technology transformation to reduce operational costs. |
|
Medium/Long-term |
|
|
Products and Services
Consumer Preference Shifts |
Consumers' preference for sustainable and eco-friendly products has increased, prompting the company to adjust its product mix and supply chain to meet demand. |
|
Medium/Long-term |
|
| Market |
|
Control raw material costs to enhance operational performance. | Medium/Long-term |
|
| Climate Resilience | Develop the capacity to adapt, make decisions, and identify opportunities in response to risks arising from climate change and extreme weather events. | - | Medium/Long-term | Based on material risks, establish emergency response measures to minimize losses and enhance operational performance. |
Climate Change Risk and Opportunity Matrix
| Category | Impact Description and Financial Impact | Opportunities | Response Strategies |
|---|---|---|---|
| Transitional Risk – Policies and Regulations (Update) | In response to policies such as carbon fee levies, energy-saving and carbon-reduction mandates, and ESG compliance, low-carbon energy costs are expected to rise. If adjustments are not made in a timely manner, revenue and brand image may be affected. Some costs may be passed on to consumers, potentially weakening competitiveness; energy costs are projected to increase by approximately 10%, with an annual purchase cost increase of around NT$10 million. | Acquire high-efficiency equipment to improve energy efficiency and implement low-carbon technologies.Implement comprehensive management of water, electricity, wastewater, and waste to reduce resource wastage and strengthen operational resilience. |
|
| Physical Risk – Extreme Weather: Heavy Rain and Drought | Abnormal weather events may cause power and water supply interruptions or restrictions, resulting in business disruption and increased disaster insurance costs. Simultaneously, supply chain disruptions could lead to raw material shortages and higher costs, with raw material purchase costs projected to increase by over 5% annually, approximately NT$50 million. | Utilize digital marketing and customer relationship management to expand sales channels, broaden the customer base, and establish long-term clients to stabilize revenue. |
| Category | Impact Description and Financial Impact | Opportunities | Response Strategies |
|---|---|---|---|
| Physical/Transition Risk – Rising Raw Material Costs | Rising temperatures beyond expectations may disrupt the supply and demand of agricultural products and increase transportation costs, putting pressure on operational expenses. | To address this, we are building a diversified supply chain to maintain stable product quality, while enhancing independent R&D and raw material diversification capabilities. | We focus on developing new products, increasing local sourcing, and fostering stable supply chains through partnerships with small-scale farmers. Research and development prioritize readily available or alternative agricultural inputs, and long-term cooperation agreements are established with agricultural cooperatives or local institutions. |
| Transition Risk – Changing Consumer Habits | As consumer awareness of sustainability rises, expectations for ESG performance increase, driving higher demand for low-carbon products and services. | In response, we develop a sustainable brand image and service model to strengthen market competitiveness. | Through diversified marketing, we attract consumers, enhance product quality and sustainability value, expand catering, delivery, and takeout services, and reinforce ESG communication and engagement with customers. |
Based on the identified climate change risks and opportunities, we have formulated adaptation strategies, including regulatory compliance, resource recycling and reuse, operational efficiency enhancement, energy conservation and carbon reduction, diversification of low-carbon products, and greenhouse gas emission reduction measures. These strategies aim to mitigate operational risks posed by global extreme weather events and progressively incorporate assessments of their financial impacts.
Through these measures, Regent International Hotels Group not only reduces its environmental footprint but also strengthens its resilience to the challenges of climate change, demonstrating its commitment and proactive actions as a responsible enterprise.
Greenhouse Gas Inventory
The Group has established an organizational unit responsible for promoting greenhouse gas (GHG) inventories and has developed standard operating procedures for emissions control to assist each hotel in implementing inventory tracking and carbon reduction measures. Members of this unit are required to undergo both basic and specialized training covering emission reduction strategies, energy management, energy-saving technologies, and regulatory compliance.
Hotel energy consumption primarily comes from purchased electricity and natural gas. Electricity accounts for 70–80% of carbon emissions, mainly from air conditioning and refrigeration systems, while gas usage for kitchen cooking accounts for approximately 20%, with other energy consumption contributing around 3%.
Greenhouse Gas Inventory Promotion Organization and Structure
The responsibilities of the greenhouse gas inventory promotion organization are as follows:
Manager
Approves the greenhouse gas inventory report and the identification results of indirect significant greenhouse gas emissions, and supervises the operation of the inventory team.
Executive Secretary
Supervises and provides human resource support for conducting the greenhouse gas inventory, convenes and forms an internal verification team, and reviews indirect significant greenhouse gas emissions.
Inventory Team Leader
Serves as the primary contact window for each hotel or department, handles the identification of indirect significant greenhouse gas emissions, collects greenhouse gas emission factors, prepares the greenhouse gas emission inventory and inventory report, and develops and revises relevant procedural documents and regulations for greenhouse gas inventory.
Financial Committee Member
Responsible for all accounts, provides data and receipts to the inventory team leader, and assists in verification and reimbursement.
Greenhouse Gas Emissions in Recent Three Years
| Category | 2022 | 2023 | 2024 |
|---|---|---|---|
|
Scope 1: Direct Emissions
(Metric Tons CO2e) |
2,665.092 | 5,845.230 | 5,285.2657 |
|
Scope 2: Indirect Emissions
(Metric Tons CO2e) |
9,852.591 | 9,859.210 | 9,920.761 |
|
Scope 3
(Metric Tons CO2e) |
Not Applicable | 281.810 * | 247.728 |
|
Total
(Metric Tons CO2e) |
12,517.583 | 15,986.250 | 15,453.7547 |
|
Revenue
(Million NTD) |
3,027 | 3,846 | 4,046 |
|
Emission Intensity
(Metric Tons CO2e / Million NTD) |
4.1353 | 4.160 | 3.8195 |
- Regent Taipei discloses Scope 3 greenhouse gas emissions starting from 2024
| Category | 2022 | 2023 | 2024 |
|---|---|---|---|
|
Scope 1: Direct Emissions
(Metric Tons CO2e) |
NA | NA | 415.762 * |
|
Scope 2: Indirect Emissions
(Metric Tons CO2e) |
2,017.837 | 2,338.759 | 3,858.840 |
|
Total
(Metric Tons CO2e) |
2,017,837 | 2,338.759 | 4,274.602 |
|
Revenue
(Million NTD) |
383 | 451 | 552 |
|
Emission Intensity
(Metric Tons CO2e / Million NTD) |
5.269 | 5.186 | 7.744 |
- Scope 1 statistics have not been conducted yet and are expected to be disclosed starting from 2024.
- 2024 Increase in emissions at Just Sleep Ximen Branch.
| Category | 2022 | 2023 | 2024 |
|---|---|---|---|
|
Scope 1: Direct Emissions
(Metric Tons CO2e) |
816 | 874 | 1,069.016 |
|
Scope 2: Indirect Emissions
(Metric Tons CO2e) |
3,792.86 | 4,660.071 | 3,886.921 |
|
Total
(Metric Tons CO2e) |
4,608.86 | 5,534.071 | 4,955.937 |
|
Revenue
(Million NTD) |
864 | 904 | 854 |
|
Emission Intensity
(Metric Tons CO2e / Million NTD) |
5.334 | 6.122 | 5.803 |
| Category | 2022 | 2023 | 2024 |
|---|---|---|---|
|
Scope 1: Direct Emissions
(Metric Tons CO2e) |
1,017.75 | 1,302.400 | 2,215.863 |
|
Scope 2: Indirect Emissions
(Metric Tons CO2e) |
2,938.03 | 2,902.698 | 1,489.374 |
|
Total
(Metric Tons CO2e) |
3,955.78 | 4,205.098 | 3,705.237 |
|
Revenue
(Million NTD) |
668 | 684 | 171 |
|
Emission Intensity
(Metric Tons CO2e / Million NTD) |
5.9218 | 6.148 | 21.688 * |